Christoph M. Hoeppke

Rust tick engine for high performance backtesting
In the fast-paced world of financial markets, the ability to
systematically evaluate the performance of trading strategies
is critical. Backtesting provides a data-driven approach to
assess the historical performance of trading algorithms,
enabling us to research and refine our strategies. Furthermore,
we can evaluate algorithms on synthetic data to assess their
robustness to stress scenarios and response to market risks.
The computational performance of backtesting frameworks is often
a limiting factor on the optimisation fidelity or the precision
of risk metrics we can evaluate. Here we present a framework
for accelerating the construction of historical price data.
The presented method reduces the relevant calculations for candles
by factors of up to $1.2\times 10^5$ as shown in the below table.
\[
\begin{array}{l|l|l|l}
\text{Request}&
\text{Operation count} &
\text{Reduced operation count} &
\text{improvement factor}
\\\hline
100\times 1\text{Min} & 1.2\times 10^5 & \leq 1200 & \geq 100\\
100\times 1\text{Hour} & 7.2\times 10^6 & \leq 1320 & \geq 5400\\
100\times 1\text{Day} & 1.7\times 10^8 & \leq 1370 & \geq 1.2 \times 10^5
\end{array}
\]
Many trading algorithms execute once an asset price or an
indicator breaches a threshold value. The precise development
of price action, which is lost in the usual OHLC candle representation,
can thus have a significant impact on the backtest precision.
We therefore often have no choice, but to evaluate strategies with
tick-level data precision incurring considerable computational costs.
When working on tick-level data we have both the bid and ask
prices of an asset each time the price changes. This differs
from OHLC candles, which only contain the open-, high-, low-,
and close-prices of an asset for a given timeframe, such as
1Min, 1Hour, or 1Day. Such candle-level data is often used to
calculate indicators on which we may base trading strategies.
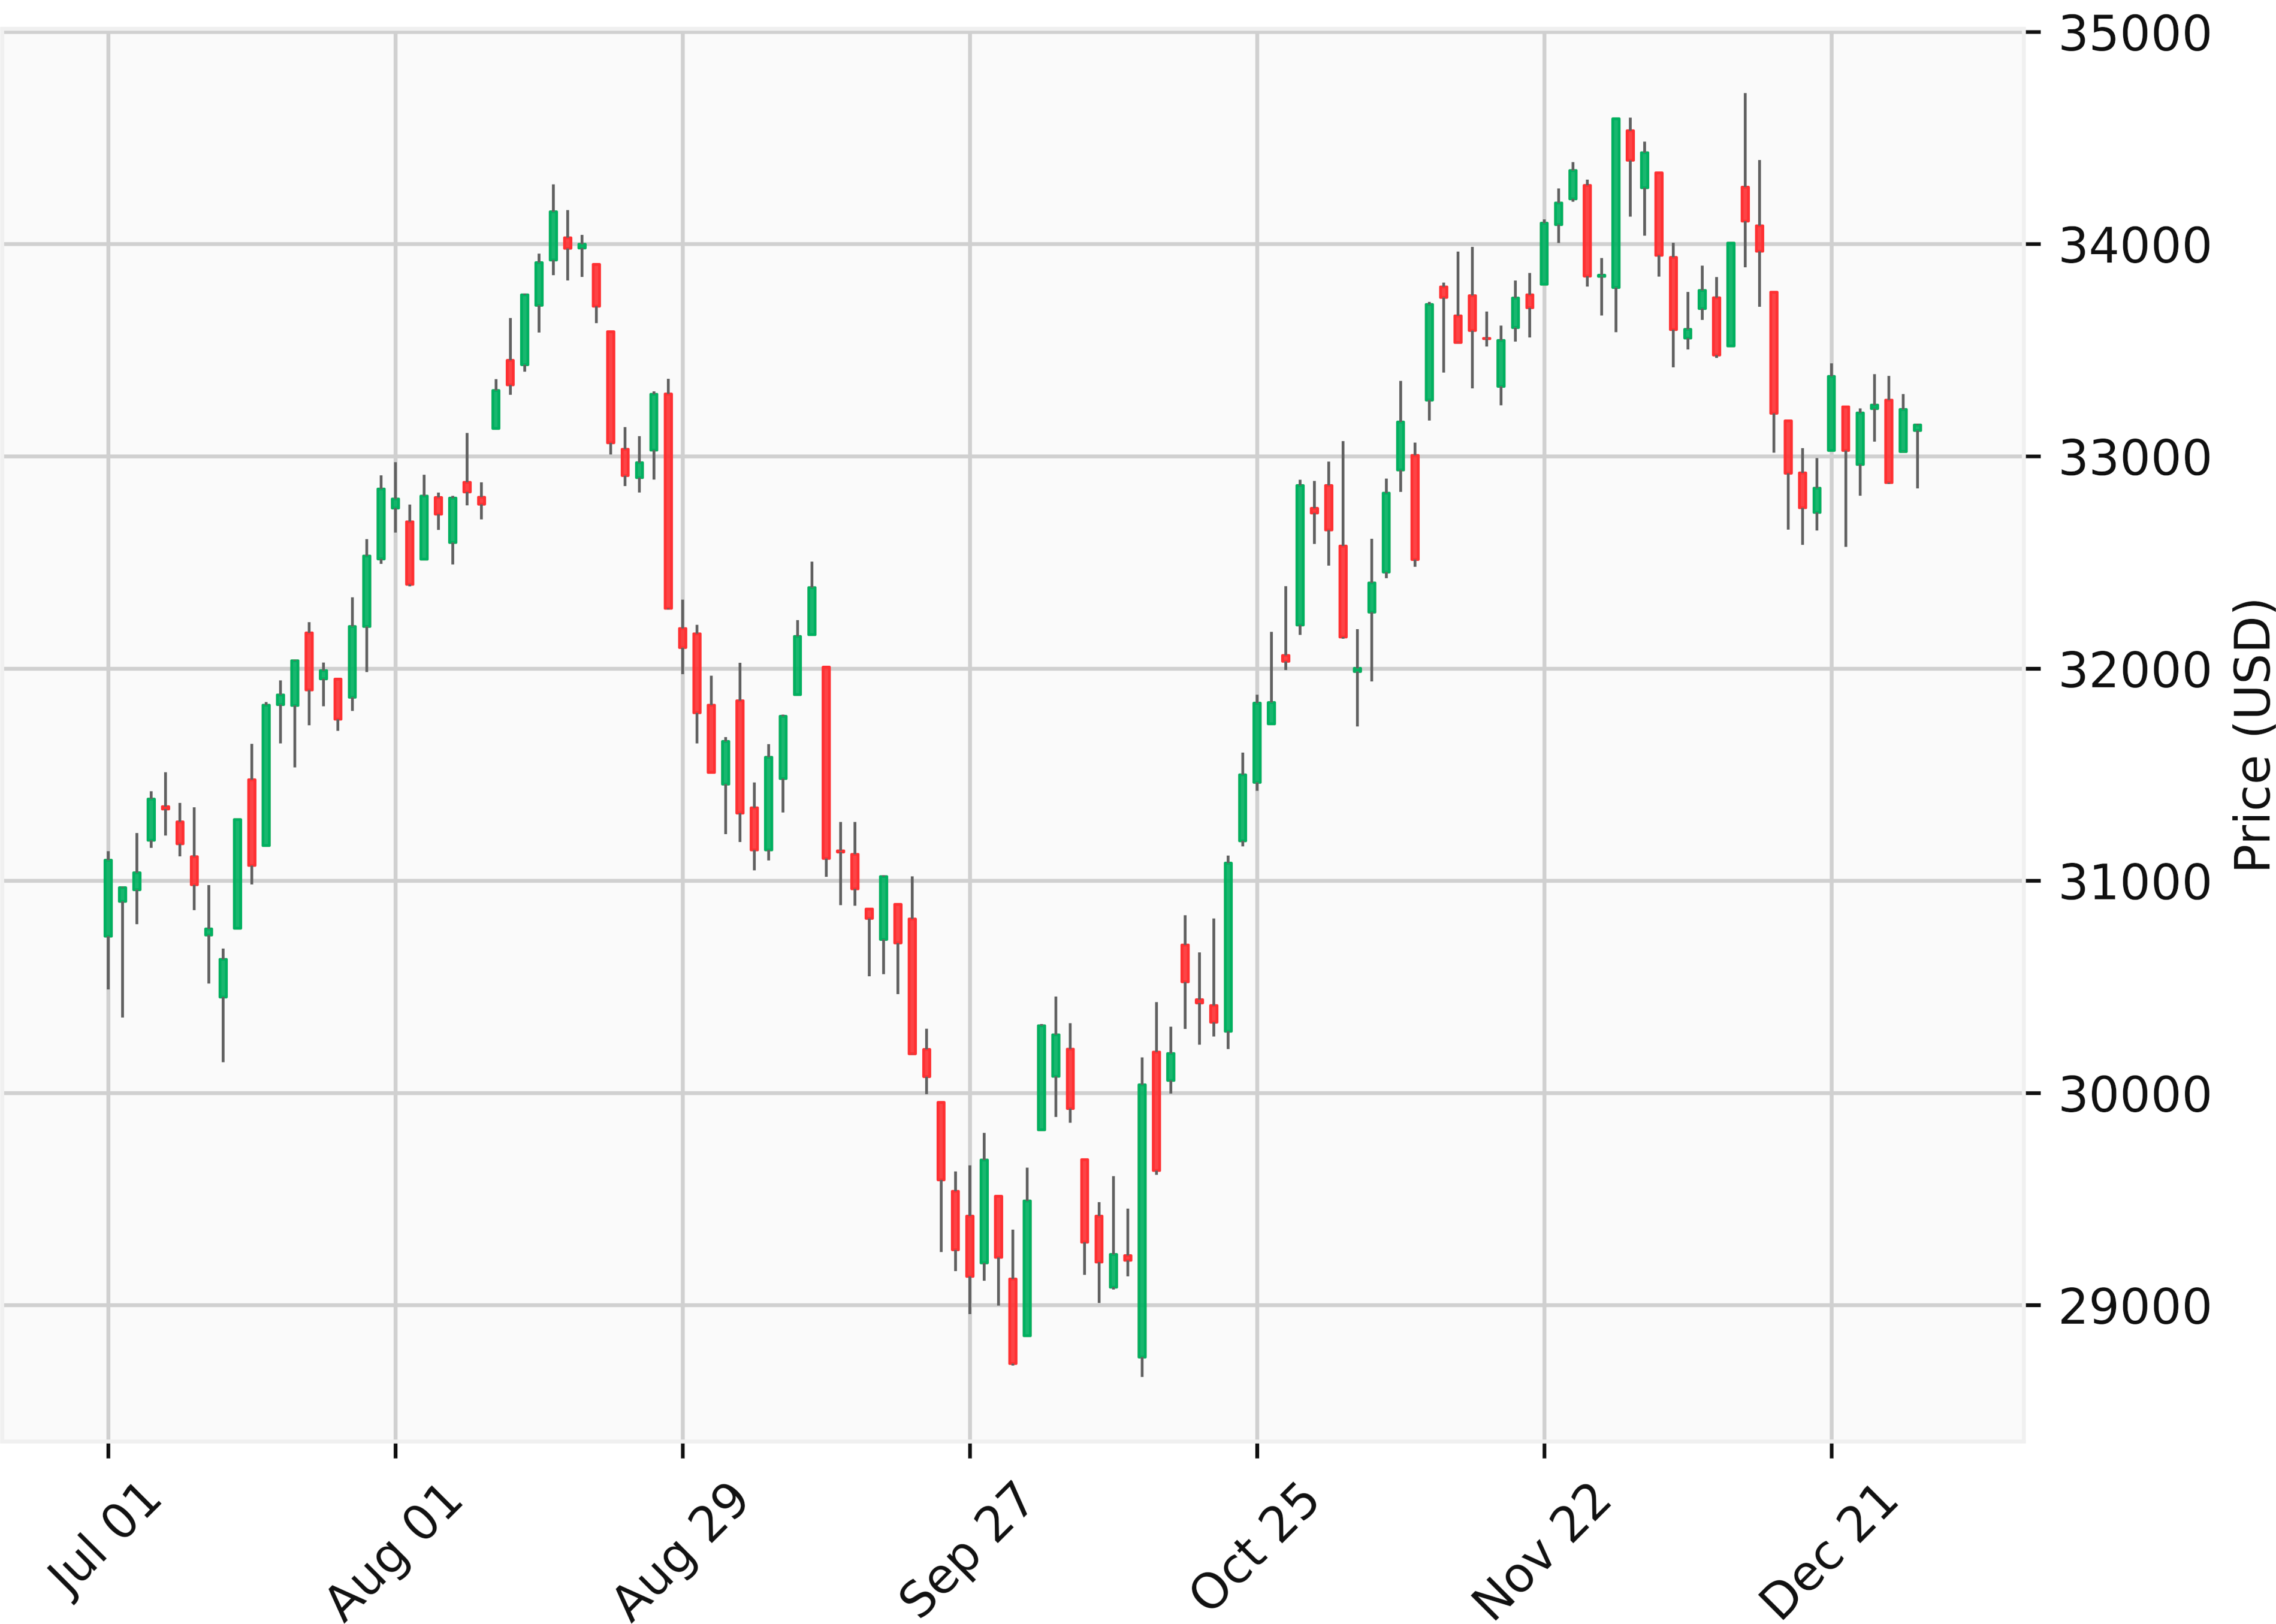
We can reconstruct candle-level data from tick-level data by
aggregating the relevant ticks, which fall within a candles
time bounds and evaluating the first, last, maximal, and
minimal prices. The below images visualises such candle
structures by showing daily price candles on DowJones (US30)
prices from the second half of 2022.
While the calculations for candle reconstruction are simple,
they quickly become computationally costly when performed at
scale. Consider a liquid and continuously traded asset like
BTC, and assume that on average we observe 10 ticks each
second. This implies we require 864,000 ticks to calculate the
daily high and low prices, indicating the high computation cost
when done at scale. During a backtest, we generally keep a
simulated time point, which we increase progressively while
executing the strategy logic. This means that the most recent
candle needs to be updated at each time step, incurring
significant computational cost.
Algorithmic design:
One way to reduce the computational cost is to exploit the forward-only structure of backtest data. However, this prevents us from effectively running multiple simulation in parallel on the same set of tick-data. We are looking for a data-structure that allows us to efficiently query candle. For these queries the end times will generally not align with candle end points, in such cases we want the last returned candle to be composed of ticks which are known up to end query end time. The tick engine we present here achieves this by exploiting the hierarchical structure, which is inherent to trading candles.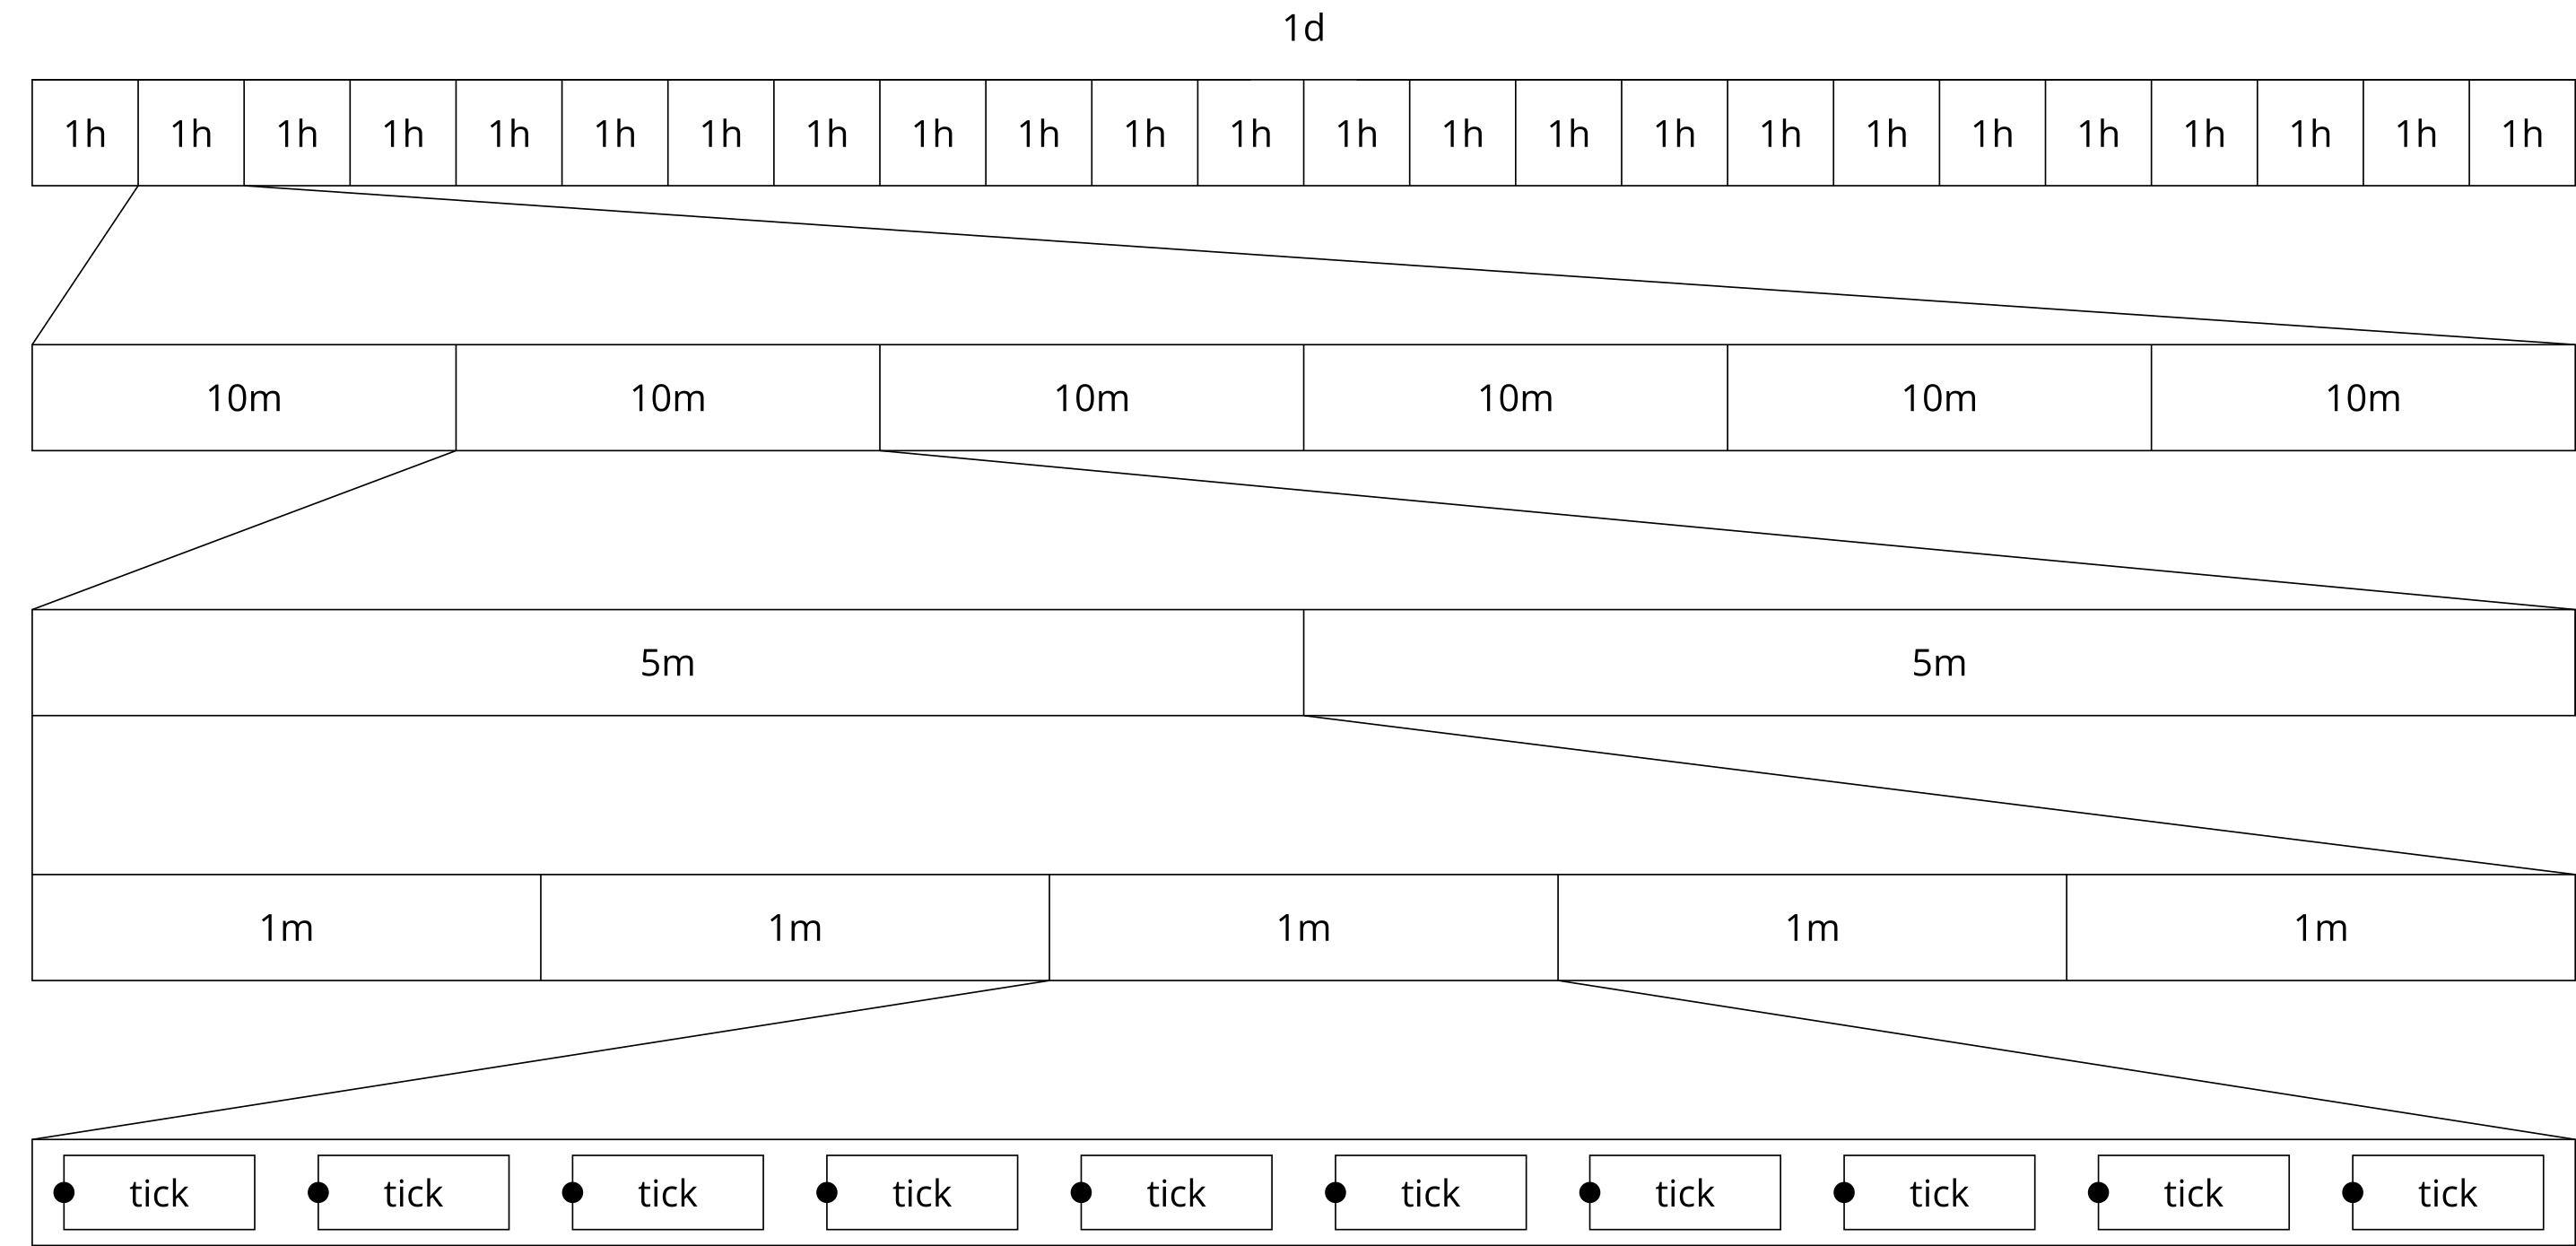
By exploiting this hierarchical time structure effectively we can request an arbitrary number of candles while only having to consider tick-level price information from the most recent 1Min, achieving considerable performance benefits.